Comparison of astrometry made by different
catalogs in 3 astrometric calibration regions
It is of
interest for astrometric observer to know the accuracy of reference
catalogs. Although TYCHO and its derivative, ACT, are known of their
high accuracy, they can not be used in relatively narrow fields
because of insufficient number of stars. Observer still depends on
less accurate, but denser catalogs. To get a glimpse of systematic
catalog errors, I present a comparison of astrometry results for the
GSC 1.1 and the ACT catalogs in three astrometric
calibration regions prepared by Stone et al. from USNO.
Astrometry of stars in these regions is assumed to be "exact" in a
sense that it is much more (factor of 10) accurate than typical
routine astrometry with modest equipment and currently available
catalogs. In addition to the above catalogs, I examined a derivative
of GSC, prepared by Bill Gray from Project Pluto. This catalog,
GSC_ACT, is a recalibrated GSC 1.1 by using the ACT positions as
reference.
Images were taken by Herman Mikuz at the Crni Vrh Observatory
in the night from May 9 to 10 May 1999 with the ACIT robotic telescope
under the same conditions as used for the asteroid search.
| Telescope | ACIT |
| Optics | 19-cm, f/4 Schmidt-Cassegrain, flat field |
| CCD | HISIS-44 1536 * 1024 pixels |
| Temperature | -30o C |
| e-/ADU | 3.03 |
| Pixel size | 2.365" * 2.365" |
| Field of view | 1 degree * 0.7 degrees |
| Exposure time | 60 s |
| Filter | No |
| |
Astrometry was made automatically with fitsblink,
using the above mentioned catalogs. After the star lists were stored
a match was found with the stars from astrometric reference regions.
This match is based on absolute coordinates. Only stars within 3 arc
seconds from the catalog stars were considered the same.
A note: If you wish to download image files or star lists, click on
links with the right mouse button and choose Save Link As.
Image files are compressed with gzip and are approx. 1.4 MB
long. For the structure of star lists please refer to the fitsblink
manual.
| Field name |
a1238 (star list) |
a1329 (star list) |
a1524 (star list) |
|---|
| Astrometric region | I | J | K |
|---|
| Targeted coordinates | 12:38:00 00:00:00 | 13:29:00 00:00:00 | 15:24:00 00:00:00 |
|---|
| Actual coordinates | 12:38:02.49 +00:00:14.1 | 13:29:01.61 -00:00:17.0 | 15:23:57.11 -00:00:20.9 |
|---|
| No. of detected objects | 547 | 496 | 795 |
|---|
| ACT average residual for ref. stars | 0.16 " | 0.12 " | 0.16 " |
|---|
| No. of ACT ref. stars | 9 | 9 | 6 |
|---|
| GSC average residual for ref. stars | 0.34 " | 0.45 " | 0.38 " |
|---|
| No. of GSC ref. stars | 91 | 92 | 90 |
|---|
| GSC_ACT average residual for ref. stars | 0.34 " | 0.46 " | 0.38 " |
|---|
| No. of GSC_ACT ref. stars | 91 | 94 | 90 |
|---|
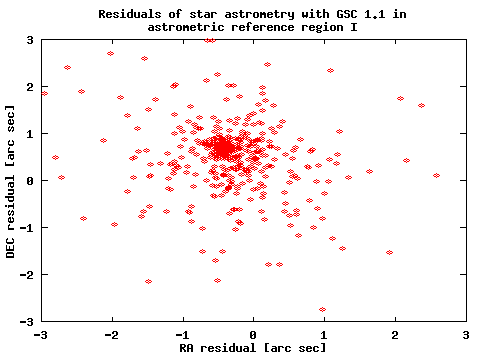
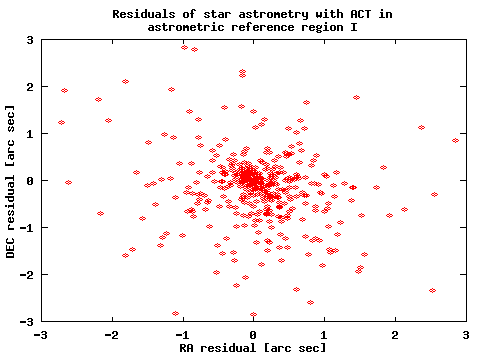
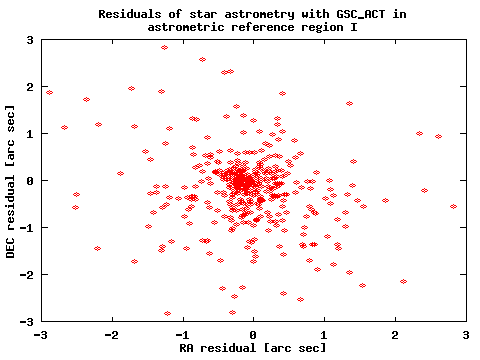
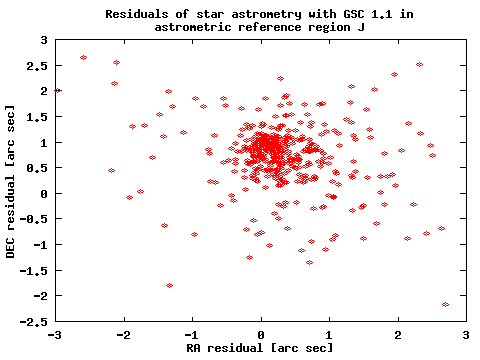
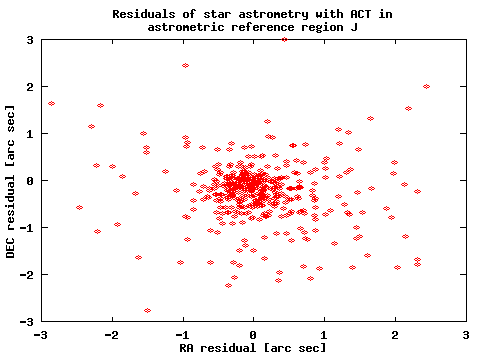
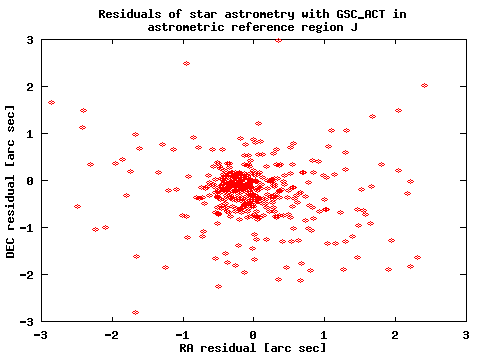
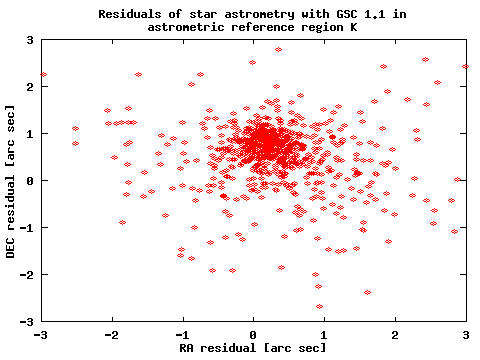
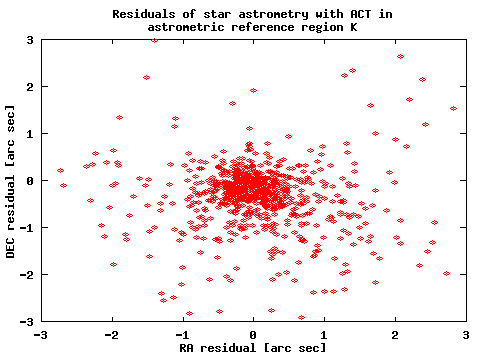
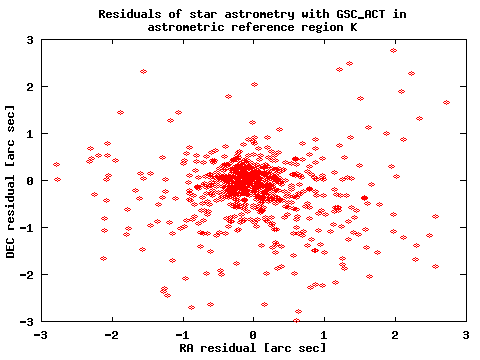
It is interesting to plot residuals of star astrometry for all fields,
separately for each catalog. It is very clear that, while the scatter
remains roughly the same, there is a large systematic shift for the
GSC catalog, which depends on the field taken. The extent of this
shift is somewhat surprising for unsuspecting astrometrist. It is
clear from these results, that ACT catalog is a preferred solution to
GSC 1.1 even for fields with a rather small number of reference stars.
However, results from the GSC_ACT seem to be very promising and it
could probably effectively replace GSC 1.1. The systematic shift is
almost completely removed. Analysis of three images only is not
enough to claim improvement for the complete catalog but this partial
result at least shows a significant improvement in comparison to the
"raw" GSC 1.1. There are other questions, which could be answered by
an analysis of deeper and more narrow images without any ACT stars.
Above all, it is a question what was the random error of GSC stars
fainter than the limiting magnitude of ACT. Unlike the systematic
error, this error was not removed in the process of recalibration.
Also, some magnitude-dependent systematic error may exist in the GSC
catalog that would also be unaffected by the recalibration process for
stars fainter than the ACT limiting magnitude.
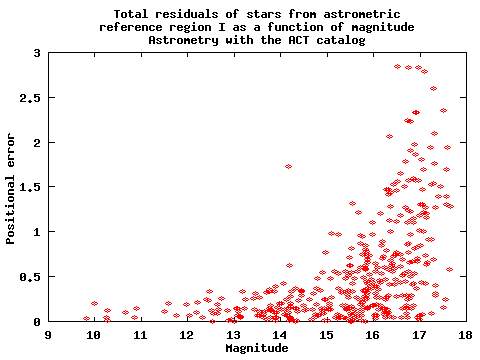
One would naturally expect that the astrometry is not equally good for
bright and faint stars. This is indeed a case, as it is evident from
the next image. Only results from the image a1238 is presented here,
other two give essentially the same results.
 Results for all images and catalogues used are in the following table,
both for all stars (limiting magnitude 17.5) and for relatively bright
stars (< 15 mag). It is apparent that the scatter of star positions
is not dependent on the catalog used, so this is clearly the result of
the astrometric process.
| Image | Catalog | Lim. mag. | No. of stars | Avg. RA res. | Std. dev. | Avg. DEC res. | Std. dev. |
|---|
| a1238 | ACT | 17.5 | 404 | 0.044 | 0.72 | -0.139 | 0.79 |
| a1238 | GSC | 17.5 | 403 | -0.329 | 0.70 | 0.497 | 0.75 |
| a1238 | GSC_ACT | 17.5 | 405 | -0.093 | 0.71 | -0.169 | 0.77 |
| a1238 | ACT | 15 | 124 | -0.009 | 0.31 | 0.013 | 0.26 |
| a1238 | GSC | 15 | 124 | -0.395 | 0.31 | 0.676 | 0.26 |
| a1238 | GSC_ACT | 15 | 124 | -0.142 | 0.32 | -0.018 | 0.27 |
| a1329 | ACT | 17.5 | 416 | 0.055 | 0.73 | -0.237 | 0.64 |
| a1329 | GSC | 17.5 | 416 | 0.289 | 0.73 | 0.728 | 0.63 |
| a1329 | GSC_ACT | 17.5 | 416 | -0.032 | 0.72 | -0.241 | 0.65 |
| a1329 | ACT | 15 | 142 | -0.089 | 0.28 | -0.072 | 0.22 |
| a1329 | GSC | 15 | 142 | 0.150 | 0.28 | 0.921 | 0.22 |
| a1329 | GSC_ACT | 15 | 142 | -0.183 | 0.27 | -0.079 | 0.23 |
| a1524 | ACT | 17.5 | 719 | 0.033 | 0.77 | -0.315 | 0.68 |
| a1524 | GSC | 17.5 | 717 | 0.282 | 0.75 | 0.543 | 0.67 |
| a1524 | GSC_ACT | 17.5 | 719 | -0.005 | 0.75 | -0.241 | 0.68 |
| a1524 | ACT | 15 | 199 | -0.050 | 0.34 | -0.104 | 0.22 |
| a1524 | GSC | 15 | 199 | 0.199 | 0.30 | 0.787 | 0.23 |
| a1524 | GSC_ACT | 15 | 199 | -0.095 | 0.31 | 0.028 | 0.22 |
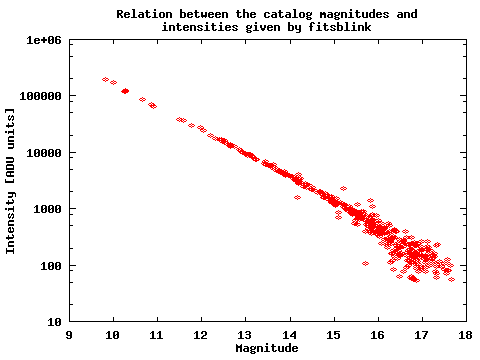
Relation between the measured intensities and the catalog
magnitudes is given in the next figure, again for the image a1238.
Note that the intensity scale is logarithmic.
