Jure Skvarc
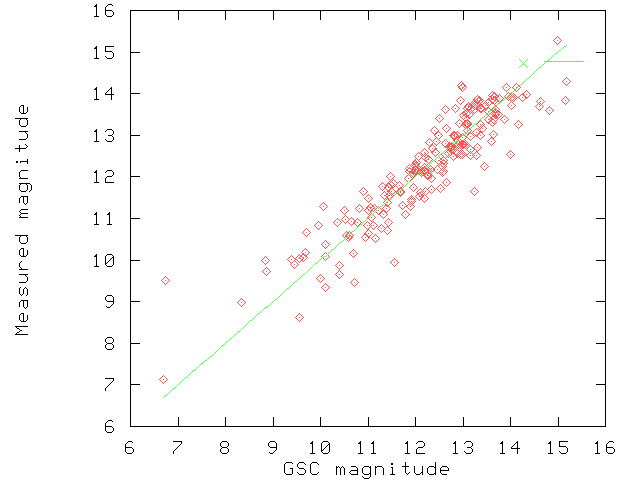
I analyzed two of the images (g0483977.fts and g0493955.fts) that Michael R. kindly uploaded to his ftp server. First I used fitsblink to make star lists and match them to the GSC catalog. The two images happen to be partially overlapped so here is an opportunity to compare the same stars on the two images. I made a small awk program to join the records from the two lists which corresponded to the same GSC stars. For beginning I made a graph which compares the measured magnitudes with the magnitudes of the GSC stars.

The trasformation between the two magnitude values was
20 + 0.8 * (-2.5 log10(v)),
where v is the instrumental star intensity and log10 is the base 10 logarithm. At the moment I do not know why the transformation between the intensities is not linear. Below are the numbers of detected catalog stars which are present in both images for each magnitude. Note that fitsblink did not detect stars close to the left and right edges.
| mag. | no. of stars |
|---|---|
| 6 | 2 |
| 7 | 0 |
| 8 | 3 |
| 9 | 8 |
| 10 | 20 |
| 11 | 41 |
| 12 | 70 |
| 13 | 54 |
| 14 | 11 |
| 15 | 2 |
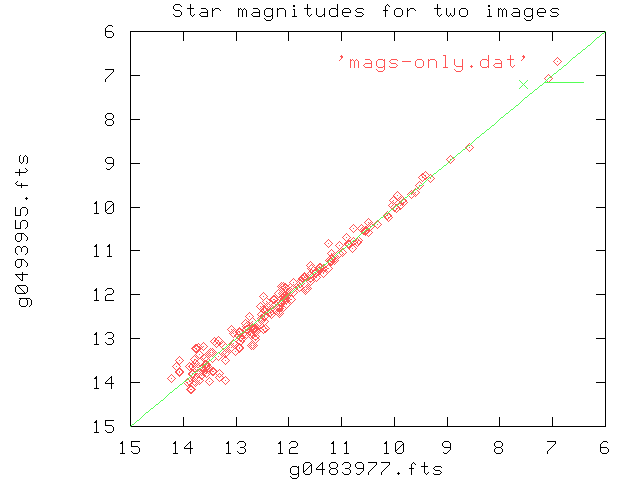
In the next step I compared star magnitudes of the GSC stars in the two images, as shown here:

The average magnitude differences and standard deviations are shown in the table below:
| mag. | n | dif. | std. |
|---|---|---|---|
| 6 | 2 | 0.0802 | 0.0044 |
| 8 | 3 | 0.0575 | 0.0090 |
| 9 | 8 | -0.0056 | 0.0100 |
| 10 | 21 | 0.0481 | 0.0167 |
| 11 | 41 | -0.0112 | 0.0092 |
| 12 | 71 | 0.0091 | 0.0398 |
| 13 | 55 | -0.0360 | 0.0648 |
| 14 | 11 | -0.0620 | 0.0931 |
| 15 | 2 | 0.2554 | 0.0022 |
Here mag. means the magnitude, n is the number of stars in that magnitude range, dif. is the average distance and std. is the standard deviation.
Now everybody wonders what has the whole story to do with data compression. This: I made a similar procedure as before, only that this time I compared results of magnitude measurements for the same image.
In the first experiment, I used a value 60 for the -s (scale) fcompress switch, what gave compression factor of 4.9 and 4.8 for g0483977.fts and g0493955.fts, respectively. The following tables show average differences of star magnitudes in non-compressed and compressed images for different magnitude values. Only stars matched with the GSC were taken into account.
| mag. | n | dif. | std. |
|---|---|---|---|
| 6 | 1 | -0.0075 | 0.0000 |
| 7 | 2 | -0.0013 | 0.0000 |
| 8 | 7 | -0.0040 | 0.0000 |
| 9 | 13 | -0.0016 | 0.0002 |
| 10 | 40 | -0.0080 | 0.0001 |
| 11 | 81 | -0.0026 | 0.0010 |
| 12 | 138 | -0.0102 | 0.0057 |
| 13 | 159 | -0.0329 | 0.0120 |
| 14 | 31 | -0.0216 | 0.0145 |
| 15 | 5 | -0.0019 | 0.0046 |
| mag. | n | dif. | std. |
|---|---|---|---|
| 6 | 1 | -0.0007 | 0.0000 |
| 7 | 1 | -0.0023 | 0.0000 |
| 8 | 7 | 0.0065 | 0.0005 |
| 9 | 16 | -0.0067 | 0.0000 |
| 10 | 44 | -0.0079 | 0.0001 |
| 11 | 85 | -0.0136 | 0.0008 |
| 12 | 168 | -0.0191 | 0.0023 |
| 13 | 171 | -0.0199 | 0.0046 |
| 14 | 76 | -0.0229 | 0.0072 |
| 15 | 6 | -0.0211 | 0.0094 |
| mag. | n | dif. | std. |
|---|---|---|---|
| 6 | 2 | 0.0189 | 0.0004 |
| 7 | 1 | -0.0047 | 0.0000 |
| 8 | 6 | -0.0015 | 0.0000 |
| 9 | 13 | -0.0065 | 0.0001 |
| 10 | 40 | -0.0101 | 0.0005 |
| 11 | 80 | -0.0166 | 0.0052 |
| 12 | 125 | -0.0301 | 0.0119 |
| 13 | 122 | -0.0832 | 0.0353 |
| 14 | 21 | -0.0905 | 0.0588 |
| 15 | 2 | -0.0742 | 0.0003 |
| mag. | n | dif. | std. |
|---|---|---|---|
| 6 | 1 | -0.0024 | 0.0000 |
| 7 | 1 | -0.0053 | 0.0000 |
| 8 | 7 | 0.0284 | 0.0065 |
| 9 | 16 | -0.0080 | 0.0002 |
| 10 | 44 | -0.0138 | 0.0004 |
| 11 | 82 | -0.0087 | 0.0017 |
| 12 | 160 | -0.0192 | 0.0070 |
| 13 | 132 | -0.0320 | 0.0237 |
| 14 | 56 | -0.0632 | 0.0319 |
| 15 | 3 | 0.0330 | 0.0297 |
| mag. | n | dif. | std. |
|---|---|---|---|
| 6 | 2 | -0.1881 | 0.0001 |
| 7 | 1 | -0.2159 | 0.0000 |
| 8 | 6 | -0.1620 | 0.0002 |
| 9 | 13 | -0.1596 | 0.0005 |
| 10 | 40 | -0.1423 | 0.0011 |
| 11 | 79 | -0.1173 | 0.0054 |
| 12 | 124 | -0.0939 | 0.0139 |
| 13 | 122 | -0.0903 | 0.0330 |
| 14 | 20 | -0.0472 | 0.0373 |
| 15 | 2 | -0.0812 | 0.0001 |
| mag. | n | dif. | std. |
|---|---|---|---|
| 6 | 2 | -0.1346 | 0.0008 |
| 7 | 1 | -0.1734 | 0.0000 |
| 8 | 7 | -0.1492 | 0.0019 |
| 9 | 15 | -0.1646 | 0.0004 |
| 10 | 44 | -0.1500 | 0.0006 |
| 11 | 84 | -0.1161 | 0.0017 |
| 12 | 159 | -0.0751 | 0.0095 |
| 13 | 134 | -0.0560 | 0.0292 |
| 14 | 48 | -0.0762 | 0.0353 |
| 15 | 4 | 0.1059 | 0.0165 |
It seems that no significant change in magnitude scatter is achieved, but we can see that few faint stars are missing in the statistic and, more apparent, that star magnitudes decrease for 0.1 to 0.2 magnitudes what leads to loss of some stars.
Conclusion: it seems to me that no significant loss in information would happen if Mark 3 images were compressed by a factor of 5 or even 10 using lossy compression with the fcompress program. Certainly, this conclusion can not be simply extrapolated and a similar analysis should be performed for every specific telescope/CCD/observatory combination.